
Reduce The Impact of Third-Party Code

Dave Peiris
9 July 2020
It’s no big secret that site speed is important, particularly for ecommerce sites. It’s been proven again and again that the faster the page load time, the better the conversion rate and the higher the average order value. And it’s also a search ranking factor across both desktop and mobile so the faster your site loads for users, the better your chance of being able to rank well in Google.
But site speed is also pretty complicated. There are hundreds of reasons for why a site might load slowly to your customers – but one issue that crops up often with the sites that we audit is the impact of third-party JavaScript.
What is third-party JavaScript?
Third-party JavaScript is code that you add to your site, but that’s hosted on a different domain. This happens all the time – Google Analytics involves adding their JavaScript tracking tag which is hosted on www.google-analytics.com. Because your site is loading it from www.google-analytics.com, and not from yoursite.com, it’s considered “third-party”.
Third-party code like this is pretty common and is used for all sorts of reasons – including for analytics, social sharing functionality, A/B testing software, and for serving ads.
But third-party JavaScript can also add an overhead to your site that degrades performance. It’s code that has to be downloaded from a different server, and then has to run – and in some cases that can take a bit of time – and that time can result in lost sales.
How do you identify slow-loading JavaScript?
If you can’t identify slow-loading JavaScript, you can’t reduce the impact it has. There are several tools out there that we at Propellernet use to find slow-loading third-party JavaScript – the most useful for us being Page Speed Insights and Chrome DevTools.
Using PageSpeed Insights
The most user-friendly is PageSpeed Insights – after running the test, look under the diagnostics section for the label “reduce the impact of third-party code” (or check under “passed audits” if it’s not there). It’ll list the most resource-intensive third-party JavaScript that loaded, along with the file size and the length of time that it blocked the main thread.
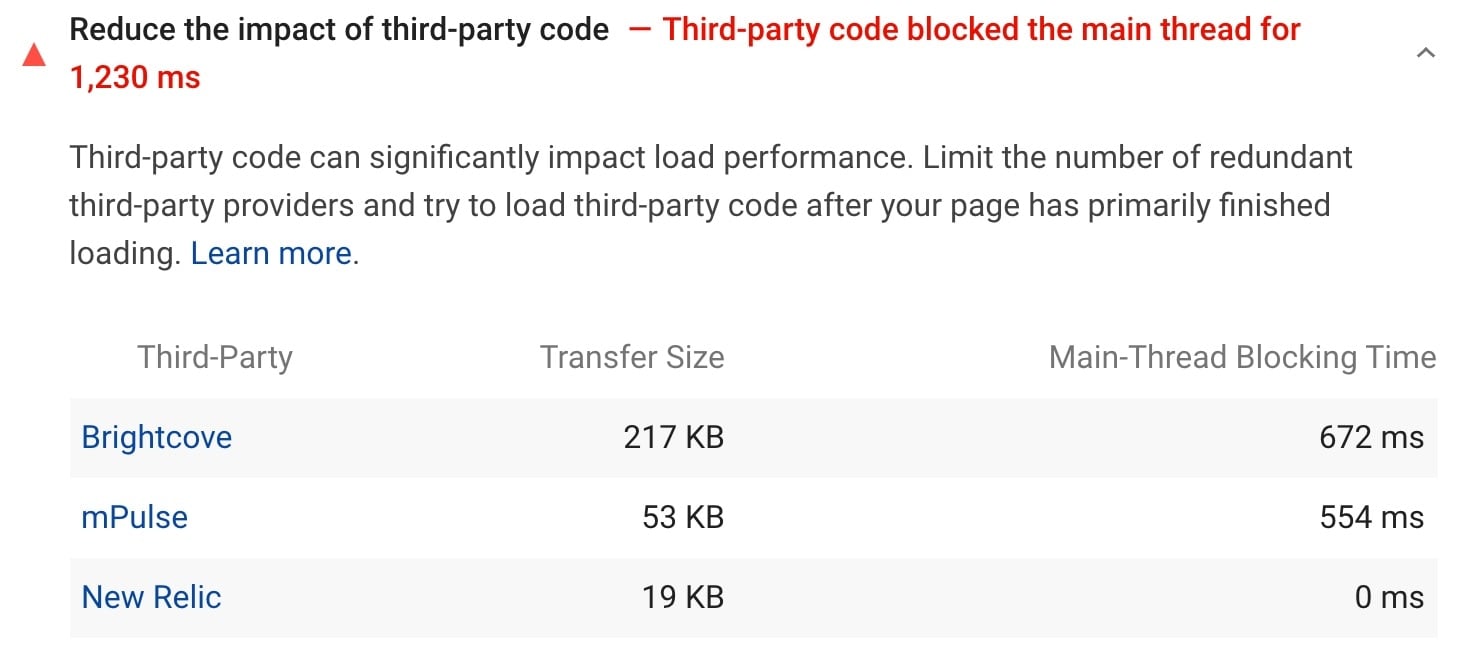
The main thread is what the browser uses to handle things like rendering content, registering user input and executing JavaScript (although it’s possible to use web workers to handle that code instead, taking it off the main thread).
Long running JavaScript tasks on the main thread can block other JavaScript code from executing, can prevent user interactions from registering, and can ultimately stop the page from rendering things until that task has finished – so it’s pretty important that long running tasks are kept to a minimum.
Once you’ve got an indication from Page Speed Insights about which third-party JavaScript is potentially slowing you down, it’s often useful to investigate it further using Chrome DevTools – which is handily built straight into the Chrome browser.
Using Chrome DevTools
Chrome DevTools is incredibly powerful and has a ton of useful information about any site that you want to audit. It can be a little daunting looking through the data at first, but when you know what to look for it can give you an incredibly useful view of what the browser is actually doing, and how much time it spends doing what.
You can bring up Chrome DevTools by right-clicking and clicking “Inspect”, or pressing Command + Option + J on Mac, or Control + Shift + J on Windows. I do this in an incognito window when I’m auditing site performance so that Chrome extensions don’t affect page load times.
Click on the Network tab, select “Disable cache” and press Command + Shift + R to hard-reload the page. You should see lots of different network requests for images, JavaScript, CSS, and more, along with information on the responses – and if you also select “Use large request rows”, you should get a bit more information for each network request.
Select “JS” to have it only show JavaScript requests, and then sort by either Size to see the largest file sizes, or Time to show the JS that took the most time to download and execute.
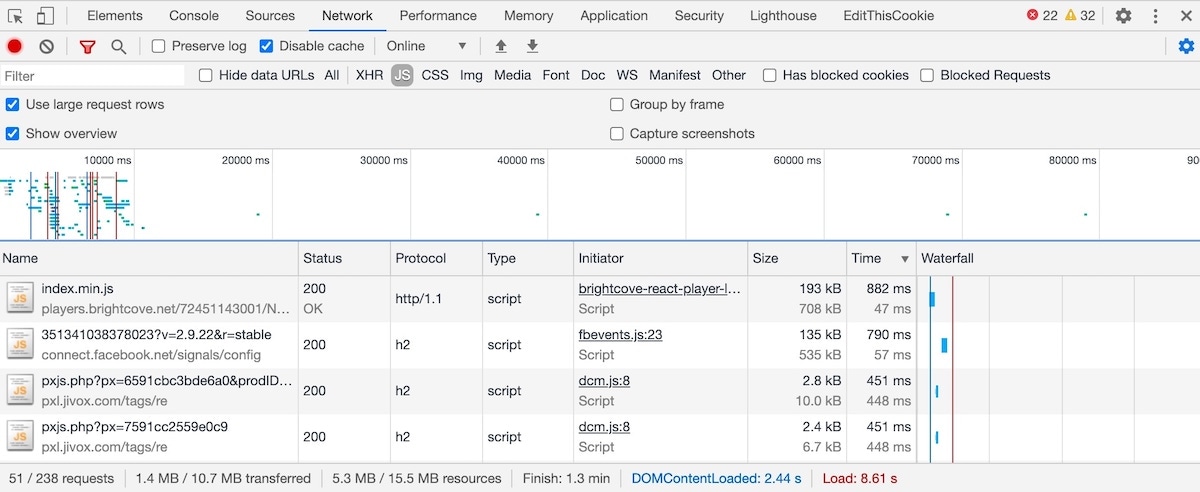
This should highlight JavaScript code that potentially is taking a long time to either download or execute (or both).
It’s also useful to note the bar at the very bottom. It shows you how long the page took to load (for you – this time is likely to be different for people on different devices and connections), how long it took for the DomContentLoaded event to fire (this is the point at which the browser has downloaded the HTML along with any critical files, and is ready to start parsing JavaScript and CSS), along with how many network requests there were, and the total file size of everything downloaded.
The Performance Report
The performance report in Chrome DevTools is another place to find third-party JavaScript that can be adding a significant performance overhead. In Chrome DevTools, click on the Performance tab and run an audit (Command + Shift + E on Mac). From there, click on the Bottom Up tab, and then click the group drop-down next to the filter box and select “Group by Domain”. You should see a list of domains ordered by how much of the page load time they were responsible for:
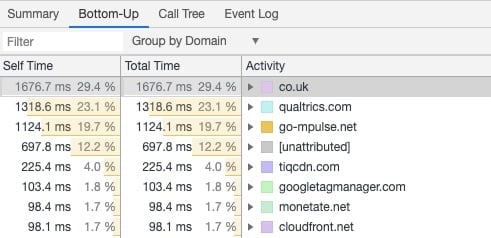
This isn’t to criticise any of the third-party code listed there, by the way – it’s very likely that large amounts of this code is useful. It’s just worth knowing how much load time they add to the page so you can determine if the code’s usefulness is worth the performance trade off.
Network Request Blocking
When you suspect that particular JavaScript files are responsible for slower page load times, it’s useful to see the performance impact of removing it – and to see whether anything noticeable breaks when you do so. I do that using the Network Request Blocking feature of Chrome DevTools.
Firstly, I load the page 3 times in an incognito window, making a note of the reported load time for each one – the median page load time (i.e. ordering the load times fastest to slowest, the median is the middle one) becomes our benchmark. Using the UK homepage of Nike.com as an example, the median load time for me at the time of testing was 7.26 seconds.
The homepage uses some third-party JavaScript to bring in a video that plays in the background. To test the impact that this JavaScript (and the subsequent video it downloads) has on the page load time, you can block the network request for that domain by right-clicking on the JavaScript that you want to block, and clicking “Block request URL”.
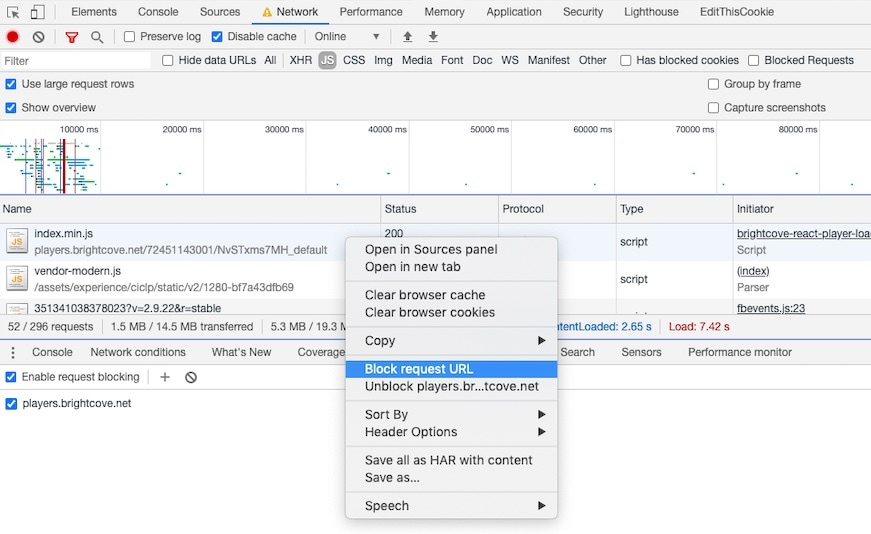
With the video player JS blocked, re-running the test 3 times and taking the median showed the homepage loading at 5.48 seconds – almost 2 seconds faster. Of course, the visual impact of showing video (rather than, say, a regular background image) might be worth the slower page load time to Nike – this isn’t a critique of the third-party tracking tag that brings in this video. This is just an example of how you can measure the page speed impact that particular JavaScript files can have on your own site (or your clients).
Improving Load Times for Third-Party JavaScript
Improving the loading of JavaScript that sits on someone else’s server is obviously quite a difficult challenge, as you’re not in a position to rewrite any of it for better performance. There are still, however, a few things that you can do to improve how it loads.
Use defer or async where you can
By default JavaScript is render-blocking. A browser can start parsing HTML, come across a regular script tag, and then pause rendering of the page while it downloads and executes the JavaScript. Here’s what that looks like:
<script src=”…”>

Blocking parsing of the HTML will increase the page load time, and in some instances (if the JavaScript takes a long time to download, or execute) this delay can be pretty significant. The browser does this by default because it’s not sure what the JavaScript might contain – it could completely change the contents of the page, and so it has to wait until it’s downloaded and executed.
But you can tell the browser to not block parsing using the async or defer attributes. The async attribute will tell the browser to continue parsing the HTML document while it downloads the JavaScript file, but will then block parsing only while it executes the JS.
<script async src=”…”>

Adding the async attribute is pretty straightforward – it involves adding “async” to the script tag like this:
<script async src="/your-file.js" />
The defer attribute is even better for performance – it tells the browser to continue parsing the HTML while downloading, and then only executes the JavaScript when the HTML has finished being parsed. Here’s how that looks:
<script defer src=”…”>

Deferring a JavaScript file is equally easy – here’s how the code for that looks:
<script defer src="/your-file.js" />
Importantly though, this shouldn’t be used for scripts that are absolutely critical to the loading of the page and that need to be executed early. Libraries like jQuery can be critical as they’re often used for layout and so it’s not recommended that those are deferred – but you might see some performance benefits from deferring the load of things like analytics or ad tracking.
Deferring the load of JavaScript can have a big impact. The Telegraph found that deferring all JavaScript – both third-party and first-party – shaved 3 seconds off the time it took for the page to appear visually complete.
It’s really important that this is tested heavily on a staging environment before deferring anything though. You need to be confident that you’re not accidentally deferring JavaScript that’s required for the page to load correctly, or that it has any unintended side effects – so you need to test it extensively before rolling it out.
Using preconnect and dns-prefetch resource hints
For some third-party JavaScript, you might see some benefit in making use of preconnect (for critical files) or dns-prefetch (for less critical files).
When a browser is rendering a page and it discovers a request for an asset (like a JavaScript file, an image or a font) that’s hosted on a different domain, it has to make a new connection to that domain. That new connection can take a bit of setup time where the browser looks up the domain name, establishes a connection to the new server and negotiates SSL. This can often be around 500-300ms (which doesn’t sound like a lot, but adds up).
It’s fairly common for browsers to discover third-party assets at various points throughout page load – which means these connections can happen throughout the render of the page. In most cases, it would be better for those connections to be made up-front, in parallel. And that’s what the preconnect resource hint does.
For your critical assets (such as images from a CDN), you can see performance gains by telling the browser to preconnect to the third-party domains that you’re going to request the assets from, by including a preconnect link tag in the head:
<link rel="preconnect" href="https://cdn.example.com">
For less critical third-party assets that aren’t required for the page to render, such as analytics, you can use dns-prefetch to get the browser to do the initial DNS setup:
<link rel="dns-prefetch" href="//www.googletagmanager.com">
<link rel="dns-prefetch" href="//www.google-analytics.com">
The setup time for domain name resolution can often be between 20-100ms, so being able to do this all upfront in parallel, instead of staggered throughout the page load can help.
As with lots of things, it’s important to test this to ensure it really is having a performance improvement on your site. If you use a Real User Monitoring tool, then make sure to check the impact when the change has gone live. Andy Davies has also written a guide on how to test the impact of preconnect before changes go live, using WebPageTest, and this is a really useful method to see whether it’s worth trying this out on your site before you get the dev team involved.
Regularly audit Google Tag Manager
Tag managers (the most popular being Google Tag Manager) are great for allowing people to add tracking tags to the site without having to rely on a developer to include it. But the drawback in making it easy to add tags is that it becomes easy to add lots of tags, and often people aren’t aware of the performance cost they can have.
In many cases, this results in loads of out-of-date tracking tags, or tags for products that nobody uses, but are still being loaded on the site.
It’s well worth reviewing your tag manager regularly to check which tags are being loaded in. If there are tags for marketing platforms that nobody uses anymore, then you can potentially make performance improvements to the site by simply removing (or pausing) those tags.
We provide a range of analytics support for our clients (including auditing Google Tag Manager), and you can find some of the things we can help you with here.
Measuring site speed
There are lots of tools that can be used to automate measuring site speed. At Propellernet, we’ve been building Blackbird, a tool that measures real user page load timings and uses your sales data to estimate the revenue impact of including third-party JavaScript, amongst other things. It’s currently in beta, and you can sign up for the waitlist here.


