The Impact of Speed on Ecommerce
Google has been encouraging site owners to focus on web performance for years. They’ve published their own research reporting that 53% of visits are likely to be abandoned if pages take longer than 3 seconds to load, they’ve made significant improvements to their own PageSpeed Insights tool, and they’ve made speed a landing page factor for both organic search and ads.
But site speed is really, really difficult. For lots of sites it’s not immediately obvious whether the site is fast or slow, it’s not easy to know why it might be slow, and more importantly – it’s not easy to prove to the people you work with (or even to yourself) that focusing on site speed improvements will lead to more revenue.
Page speed is more complicated than you might think
Page speed isn’t as simple as it first sounds. It’s not really accurate to say “it takes 4 seconds for the homepage to load”, for example – because for users on a slower connection or a weaker device, maybe that page takes 8 seconds to load in full, and users that are on a faster connection with a newer device might see it load in 2 seconds. And, of course, there could be a huge range of visits that fall somewhere in-between. With that in mind, I’ve started to think more in terms of there being fast and slow visits rather than fast or slow pages.
That’s where one of the issues comes in with using a lab tool like Page Speed Insights. It’s a great tool, and gives some really useful information – but you have to remind yourself that it’s just one data point (i.e. it’s the data from one visit), and that one visit is not likely to be representative of thousands or millions of your visitors using a range of different devices, on different connections, around the world.
The most accurate way to deal with this is to use a Real User Monitoring tool to record exact speed metrics, down to the millisecond, for every single visit. You can then take the average of all visits to the site to better understand how quickly – or how slowly – the site loads for your users.
Do faster visits have a better conversion rate?
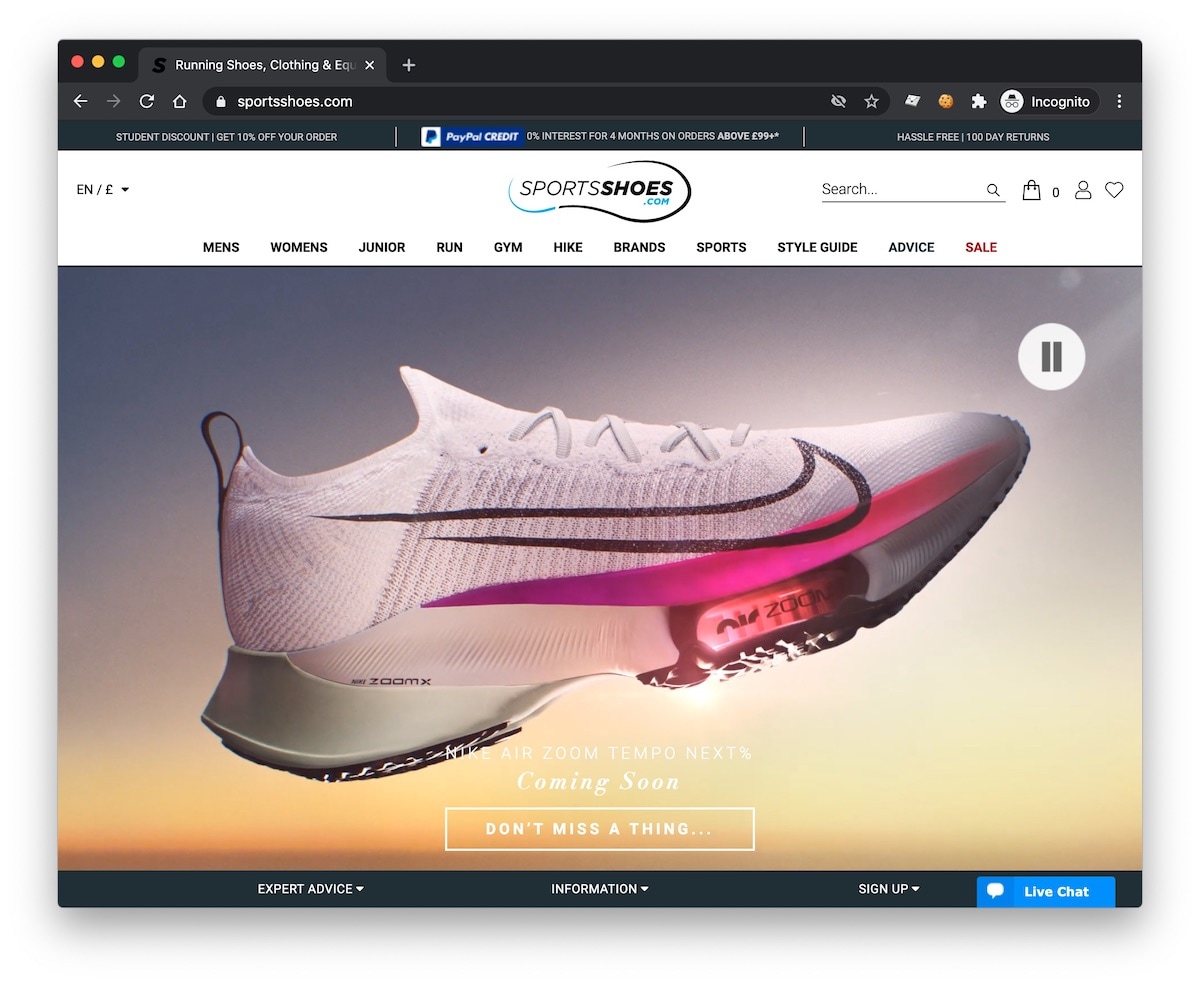
And that neatly leads us onto the experiment that we wanted to run. We do a lot of work with SportsShoes.com, and we wanted to know whether people who saw the site load quickly had a better conversion rate than those who didn’t. Based on all of the studies from Google (and many others), our theory was that fast visits would convert better. But we weren’t sure if it would be noticeably better.

The Study
We used our own RUM tool – Blackbird – to track highly accurate landing page speed metrics (down to the millisecond) for every visit to the site. Blackbird also tracks when conversions happen, and what the order value is, so we can determine the conversion rates for faster vs slower visits.
We found that faster-than-average visits were 34% more likely to convert versus slower-than-average visits
There’s a problem with just that top-level stat though. There’s a big difference between user behaviour on mobile compared to desktop. For lots of retailers, we typically see a higher conversion rate on desktop compared to mobile – so it’s useful to break those out into their own separate groups. With that same data set, we found that desktop visits that were faster than the average desktop load time were 19% more likely to convert compared to slower than average desktop visits. But the difference is remarkable when it comes to mobile.
We found faster-than-average mobile visits were 41% more likely to convert versus slower-than-average visits
That is a very clear, very compelling reason to focus on improving mobile page load times wherever possible.
iPhone vs Android
There was something that was still bothering me about these findings though – and that’s the difference between iPhones and Android devices. Ecommerce retailers often see a better conversion rate on iOS compared to Android. It could be for lots of different reasons – one theory is that people who are willing to pay for a more expensive iPhone are likely to be less price sensitive. But iPhones often tend to be better powered than many Android devices, and so often have faster page load times. This was certainly true for SportsShoes, as visits from iOS were clocking in 22% faster than Android visits, with the median average iOS load time at 1,714 ms compared to Android’s 2,143 ms.
I wanted to know if our theory – that faster visits had a noticeably better conversion rate – would hold up if we split out iOS and Android. And our study shows that yes, it very much does, for both operating systems:
Faster-than-average visits on iOS were 35% more likely to convert, and faster-than-average visits on Android were 31% more likely to convert
Of course, your results might be different – the only way for you to know for sure is to test it using a RUM tool. You can find out more about the tool we used to get this data (and find out when it launches) at tryblackbird.com. And of course, a huge thank you to the team at SportsShoes for letting us run this test, and for letting us share what we’ve found.


